Fig 1. - Growth of the Down's Syndrome Foetus compared with normal
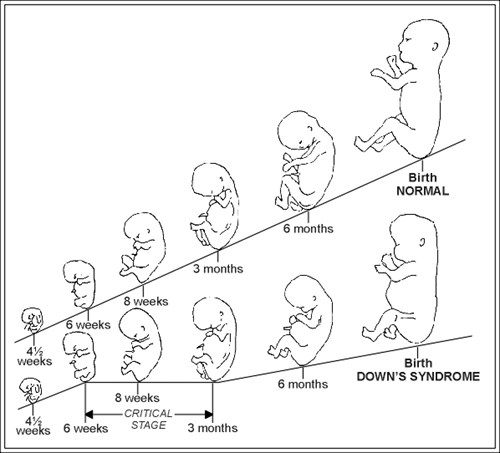
GROWTH of the DOWNS SYNDROME FOETUS COMPARED with NORMAL (redrawn after Benda [2])
Prenatal development from 4½ weeks to birth. The upper line represents normal development.
The lower line represents the deceleration of normal development and differentiation seen in Downs syndrome